Monitoring AI model uptime requires a different approach than traditional web services. Because LLM inference is probabilistic and resource-intensive, a simple 200 OK status code is insufficient; you must also track latency, error rates, and token throughput to detect silent failures or model degradation. In this guide, we will implement a robust monitoring wrapper to track the health of your AI integration in real-time. You will learn how to instrument your inference calls, implement interval-based health checks, and structure your logs for actionable alerting.
Prerequisites
- 1. Python 3.9 or higher installed on your system. 2. A valid AI provider API key with sufficient permissions. 3. Access to a logging service or observability platform (e.g., Datadog, Prometheus, or a structured log file). 4. Basic familiarity with the OpenAI Python SDK and error handling patterns.
Steps
- 1
Define a Lightweight Health-Check Prompt
Create a minimal, low-latency prompt designed specifically for uptime verification. This query should be small enough to execute quickly, allowing you to isolate infrastructure latency from model complexity.
- 2
Instrument Your Inference Wrapper
Wrap your standard SDK client call in a function that captures performance metadata. Ensure you record the start time, completion time, and any exceptions thrown by the API client to differentiate between network issues and model errors.
- 3
Implement Interval-Based Polling
Use a simple background task or cron job to trigger your health-check function at fixed intervals, such as every 60 seconds. This creates a consistent heartbeat signal that helps you distinguish between intermittent hiccups and sustained downtime.
- 4
Capture and Log Key Metrics
Output your metrics in a structured format like JSON to your logging pipeline. Include the model name, response time (latency), error code if applicable, and a boolean flag indicating whether the inference was successful.
- 5
Configure Failure Thresholds and Alerting
Set alert conditions in your observability tool that trigger when the success rate drops below 95% over a five-minute window or when latency exceeds a specific percentile threshold. This prevents noise while ensuring you are notified immediately of outages.
Code
import time
import logging
from openai import OpenAI

client = OpenAI(base_url="https://api.select.ax/v1", api_key="your_api_key")

def monitor_uptime():
    start_time = time.time()
    try:
        response = client.chat.completions.create(
            model="smart-select",
            messages=[{"role": "user", "content": "ping"}]
        )
        latency = time.time() - start_time
        logging.info(f"Health check passed. Latency: {latency:.2f}s")
    except Exception as e:
        logging.error(f"Health check failed: {str(e)}")

if __name__ == "__main__":
    logging.basicConfig(level=logging.INFO)
    while True:
        monitor_uptime()
        time.sleep(60)
Pro tips
Distinguish Rate Limits
Always handle 429 Too Many Requests errors separately from 5xx server errors to ensure your uptime alerts don't trigger due to intentional throttling.
Log Prompt Metadata
Include the specific model version or checkpoint name in your logs to identify if downtime is isolated to a specific deployment version.
Use Synthetic Monitoring
Run your health checks from different geographic regions to identify if availability issues are localized to a specific data center or cloud provider zone.
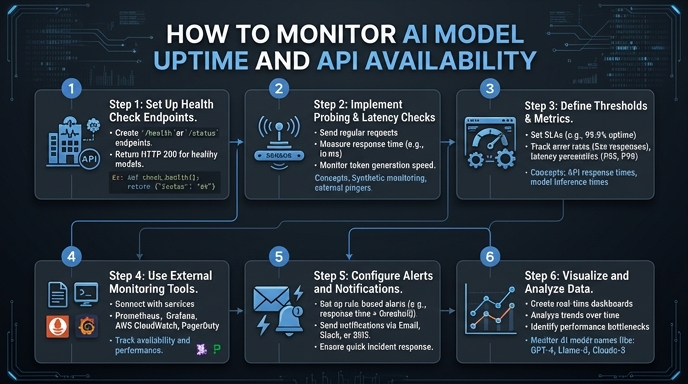
Visual guide
Route your models intelligently
Use one API key for routing, fallback, and cost control across model providers.
Route your models intelligently — try Select